The Pictorial Library of Bible Lands is an extensive collection of high-resolution photographs. The photos come two ways: in folders of jpeg images and in pre-made PowerPoint presentations. With the massive revision of the collection some brand new features were included which were not in previous versions, and I would like to highlight two of them. The first of these new features is maps which are included in each PowerPoint presentation.
A total of 43 maps were created for the revision of the Pictorial Library of Bible Lands. There are altogether 383 PowerPoint presentations among the 18 volumes of the Pictorial Library, and about 77% of these contain maps. (The exceptions are volume 15—no map was made of the city of Rome—and volumes 16, 17, and 18, which do not lend themselves to mapping.)
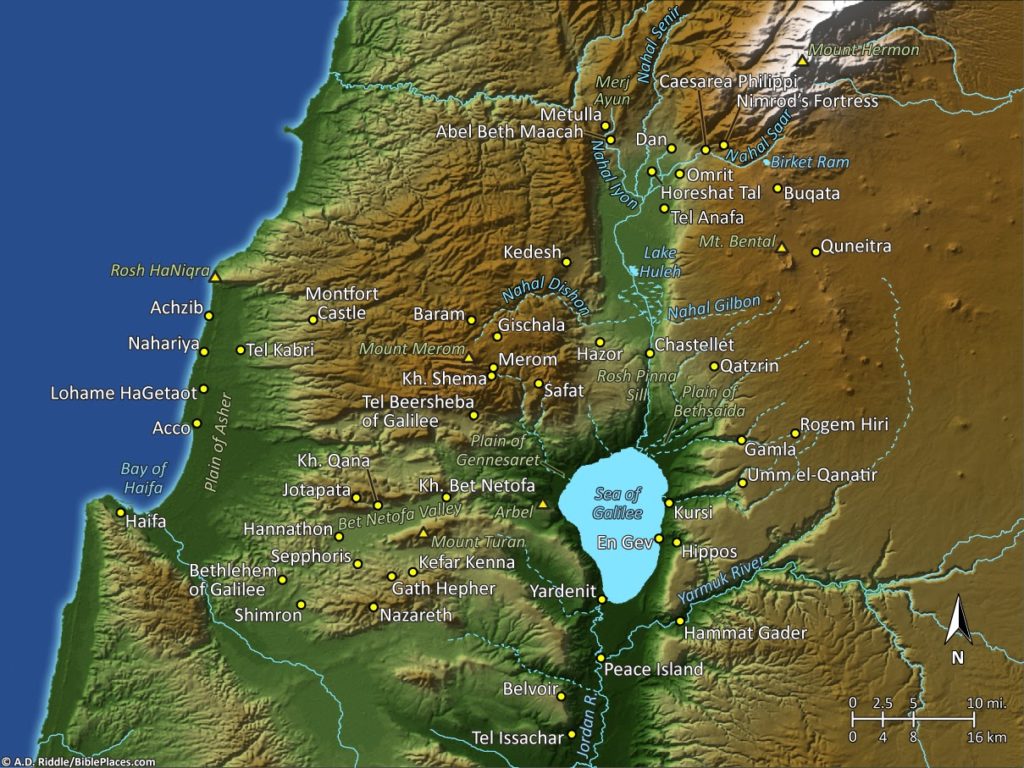
The Pictorial Library contains all the familiar sites, but it also has many biblical and historic sites that are not as well known. The maps are provided to help the user find where a site is located, without having to consult a separate source. Virtually every site and geographic feature which appear in the Library‘s photographs are marked on the maps. This results in maps with a mixture of both modern place names and ancient ones. The places which appear in any given PowerPoint are marked by a red star on the map(s) next to the name so that users can quickly locate that particular site or feature.
Second, the labels and linework also have a color scheme. The white labels are used for cultural features, that is, features which have been created by human beings, such as settlements, tumuli, or temples. Yellow labels and lines indicate routes, either natural or man-made; green labels indicate geographical features (plains, valleys, mountains); and blue labels indicate water features (rivers, lakes, springs). The yellow dots indicate cities, springs, or other sites such as aqueducts or tumuli.
One thing that cartographers have to consider is changes in coastlines and lakes over time. Will the map represent a historical state, the modern one, or perhaps a mixture of both? The maps in the Pictorial Library of Bible Lands show the modern coastline and the modern Sea of Galilee and Lake Huleh. But the shape of the Dead Sea, as with the majority of maps of Bible lands, dates to 1975 and before. If we had used the modern shape of the lake, only the northern basin would be blue, because today the southern basin is dry due to lowering of the lake level.
The maps are an important new feature in the Pictorial Library of Bible Lands and are one of the ways in which we have tried to make the collection more user-friendly. In a follow-up post, we will describe some of the steps in the map-making process.
[Click here for Part 2]

4 thoughts on “Pictorial Library New Features: Maps (Part 1)”
I'm having a hard time telling if this is a new (2014) upgrade or if it is highlighting the 2012 release. I purchased the Israel set, plus a few others last year (2013), so are these maps newer than that?
The current edition was released in 2012. We're calling it "new" because (1) it took 9 years to create the current edition; (2) we've been busy since then and have not been able to highlight some of these things as we intended.
The maps described this week are all included in the revised (2012) edition of the Pictorial Library, except for the Patmos map, released today for the first time.
We apologize for the confusion.
Thanks for the clarification. I'm really enjoying the photos and PowerPoints.
One more question, if I may. I find maps in most of the PowerPoint presentations. I'm gathering that the jpegs are the ones embedded in the slides and that there aren't separate jpegs of the maps. Is that correct?
You are correct.