Many of you are likely familiar with the excellent work of Biblical Backgrounds, led by James Monson and Steven Lancaster. They have been producing outstanding resources since 1980, including Regions on the Run, Geobasics in the Land of the Bible, and the very useful Regional Study Maps.
They now have a new resource that I’ve been waiting for a long time. In a way. Actually, I’ve been using this chart for the past 20 years, while it was “under development.” I don’t remember how I first learned about it, but whenever I was scheduled to teach my History of Ancient Israel class, I would contact Biblical Backgrounds and they would go down to the print shop and have another 50 printed and shipped off to me. I was very grateful.
My students loved it, but I had to tell them to guard the one they had, because they couldn’t get another one unless they signed up for the class again. But now that’s changed, and Jim and Steve have released a set of three “Gateways” – beautiful foldouts that pack a ton of historical and geographical detail in a tight frame.
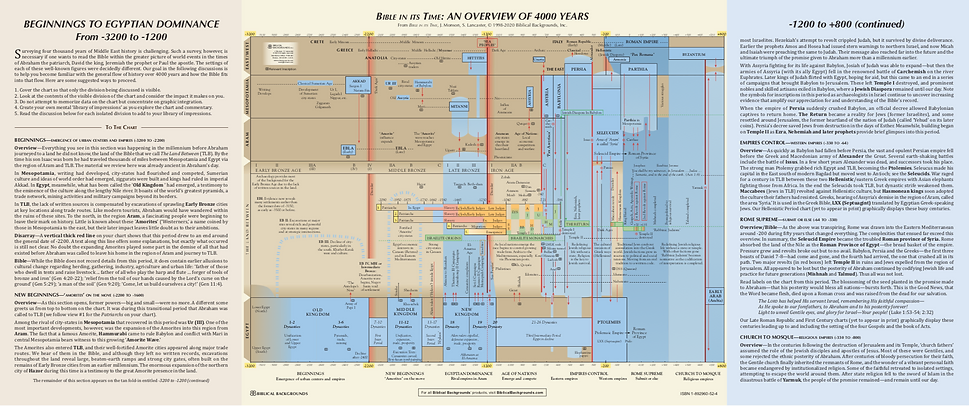
I want to tell you about the one I’ve used so happily these many years. It’s called “Bible in its Time: 500 Years of Israelite Kings.” The heart of it is a chart that merges time and space, history and geography. The vertical axis represents north and south and the horizontal axis presents the passage of time from 1040 to 540 BC.

The colors are what brings the story to life, for you can see at a glance the sweep of the rise and fall of kingdoms by the color scheme. The color green represents Judah and orange represents Israel, and the spikes and dips reveal their national expansions and contractions. In a few seconds, you can easily see Judah was strong under David-Solomon, Jehoshaphat, and Uzziah. Not only that, you can see that this didn’t happen in a vacuum, for when Israel rose, another power ebbed.
The most powerful “swoop” on the map is the big blue color representing first Assyria and then Babylon, coming down from the north, initially in the time of Ahab, but then “for good” when they conquered the northern kingdom in 723 and then applied severe pressure on Judah until its meltdown in 586.
In the midst of all the colors lie the details. The big picture draws you in, and then you grasp the specific events through the red boxes that illustrate conflicts and the arrows that reflect contacts. If a picture is worth a thousand words, this chart is worth 10,000. Here’s just a quick list of some of what you can readily reference:
- The dates of all the kings of Israel, Judah, Assyria, and Babylon
- The various coregencies in the northern and southern kingdoms
- The names of the kings of Phoenicia and Aram
- The dynasties and pharaohs of Egypt
- The moving capital of the northern kingdom
- The names and time periods of the prophets of Israel and Judah
- Visual representation of every major battle between Israel and Judah and neighboring powers (including Shishak’s invasion, Qarqar, Aramean oppression, Jeroboam II’s expansion to Hamath, Assyria’s invasions of Egypt, Babylon’s various campaigns against Judah)
The format of this and the other Gateways is a foldout the size of a single sheet (11×6.6 inches) that unfolds into 8 panels/pages. The central two panels have the featured chart. The other panels explain the chart, providing a narrative description of the historical events of the era.
I’ve been waiting for this to be available for a long time, and I am very glad that anyone and everyone can now get their own copy. At only $7, you can buy a few for all the favorite Bible students in your life.
I’ll say just a brief word about the other two Gateways. The second “Bible in its Time” Gateway is “An Overview of 4000 Years.” This does just what it says in providing a full-colored chart of the major kingdoms of the ancient Near East from the earliest civilizations through the Old and New Testament eras and ending with the Arab conquest in the 7th century. This is the bigger picture that many will want before they focus in on the Israelite monarchies.
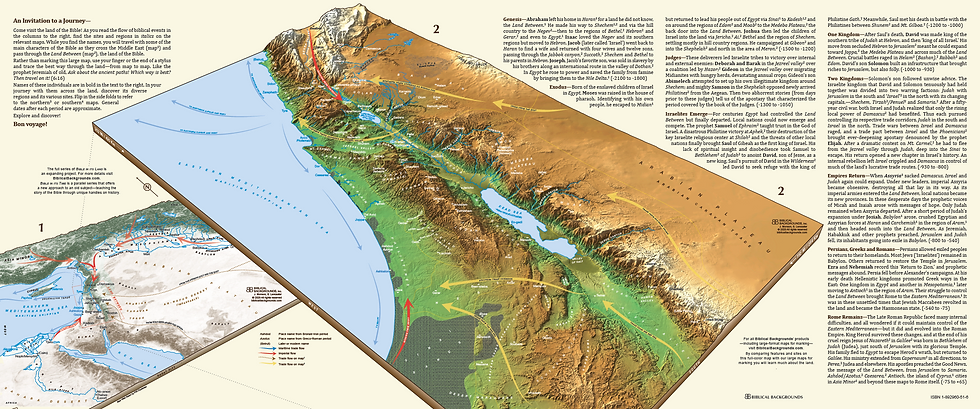
The third Gateway is “Bible in its Land: The Land Between Concept.” This concept goes back to the origins of James Monson’s instruction in the land of Israel in the 1970s, and while he has developed this at greater length elsewhere, this Gateway provides a quick introduction to the geographical dynamic of the land, featuring several smaller maps and one gorgeous 3-D map that spans much of four panels.
You can purchase a set of all three Gateways for a reduced price. (I just checked shipping, and it looks like it’s $9 in the US for up to 5 sets or 8 individual Gateways, so it’s to your advantage to purchase the set and/or gifts.)
As I said above, my students find the Israelite Kings chart to be extraordinarily helpful in conceptualizing the mass of details their merciless professor throws at them. It’s the ultimate study and reference guide for ancient Israel. If you’ve ever wanted to untangle the knot of biblical history, it’s never been easier.